Published on April 10, 2018 by Santosh Kumar
The top 25 market research companies are increasing their focus on and investments in social media, data visualization, and analytics. The research industry’s drift toward analytics is well under way.
More than 70% of respondents (comprising suppliers and clients) in the GRIT survey conducted by GreenBook in Q1 2018 showed interest in analytics, as per the GRIT Q3-Q4 2017 Report. Around 30% used analytics in their research, while approximately 30% were considering the use of analytics.
Do analytics apply to only Big Data (and not survey data)? Usually, when we hear the term analytics, the first thing that comes to our mind is Big Data. Analytics is associated with mostly prediction and prescription. It can be categorized into four main branches – descriptive, diagnostic, predictive, and prescriptive. The right analytics technique, selected on the basis of the research objective and type of data collected would yield insights into even survey data.
We can safely apply descriptive and diagnostic analytics to survey data, to derive insights and support results and trends that emerge from tables and charts.
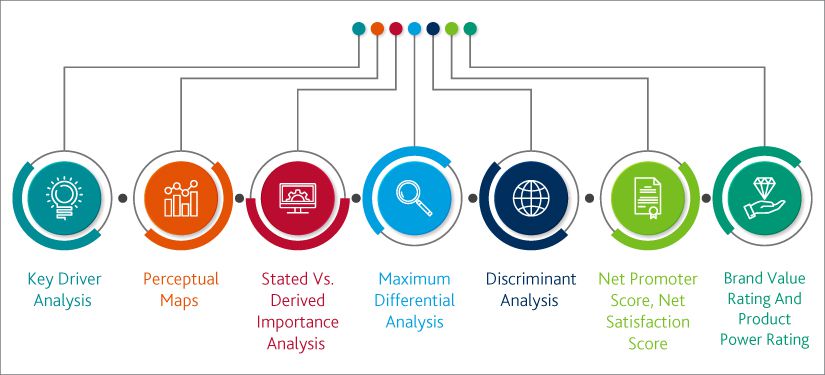
Analytics techniques used in survey data include:
Key driver analysis
Perceptual maps
Stated vs. derived importance analysis
Maximum differential analysis
Discriminant analysis
Net promoter score, net satisfaction score
Brand value rating and product power rating
Below is a real life example of how our clients are using analytics to drive business transformation.
A leading cruise company was facing a challenge in identifying key attributes which would improve the willingness of customers to recommend their cruises. Although the company had the necessary data it needed it to be processed and presented in a way which enabled management to take data driven decisions.
We worked with the client and used our expertise in R to cleanse data and perform complex computations on the survey data to convert it into actionable insights. Further, we integrated our survey tool with R to fetch the survey data in real time. Finally, we integrated R script with a visualization tool to showcase the results over a web link.
Using the solution, the client could easily deep dive the results based on destination, ship, and sailing frequency (daily, weekly, monthly, and quarterly). Consequently, using the insights the client increased the ‘willingness to recommend’ KPI by 14%.
What's your view?
About the Author
Santosh has nearly 18 years of experience in quantitative and qualitative primary research. He is responsible for providing research and insight support to market research agencies, helping them prepare key insights for business processes.
He has successfully delivered syndicate and ad hoc projects related to diary data, pharmaceutical data, and product/concept tests. Over his 16-year tenure with Acuity, he has been responsible for conceptualising specific client needs and framing solutions to assist in business development efforts. Prior to joining Acuity, he was employed with Annik, where he delivered data analysis projects. Santosh holds a Bachelor of Commerce degree from..Show More
Comments
10-Apr-2018 04:19:18 am
Very well written Santosh Sir! Leveraging the power of R for creating live dashboards, for survey data would definitely help clients to reap benefits!
Like the way we think?
Next time we post something new, we'll send it to your inbox


